DCAM
Dynamic Contextual Alpha Model - IC 0.087, 6.5-8.3% excess return
Overview
| Company: Infinity Capital Management | Role: Quantitative Researcher Intern | Period: Mar-Jul 2024 |
Multi-factor equity model with dynamic factor weighting and momentum signals, applied as index enhancement strategy across CSI benchmarks.
Key Results:
- IC: 0.087 with ICIR 0.589
- Annual excess return: 6.5-8.3% across CSI benchmarks
Methodology
Context-aware factor stratification with ICIR-based dynamic weighting. Traditional models apply uniform weights; DCAM adjusts for context since large-cap value behaves differently from small-cap growth.
Architecture:
- 70% ICIR Baseline: Stratify by market cap, B/P, growth
- 30% ML Predictor: ElasticNet for factor-return prediction
- Lowdin orthogonalization for factor decorrelation
Process:
- Stratify universe by context factors
- Calculate IC within each stratum
- Apply 24-month rolling ICIR weighting with 6-month momentum
- Blend with ML predictions using z-score normalization
Results
Long-Short Performance
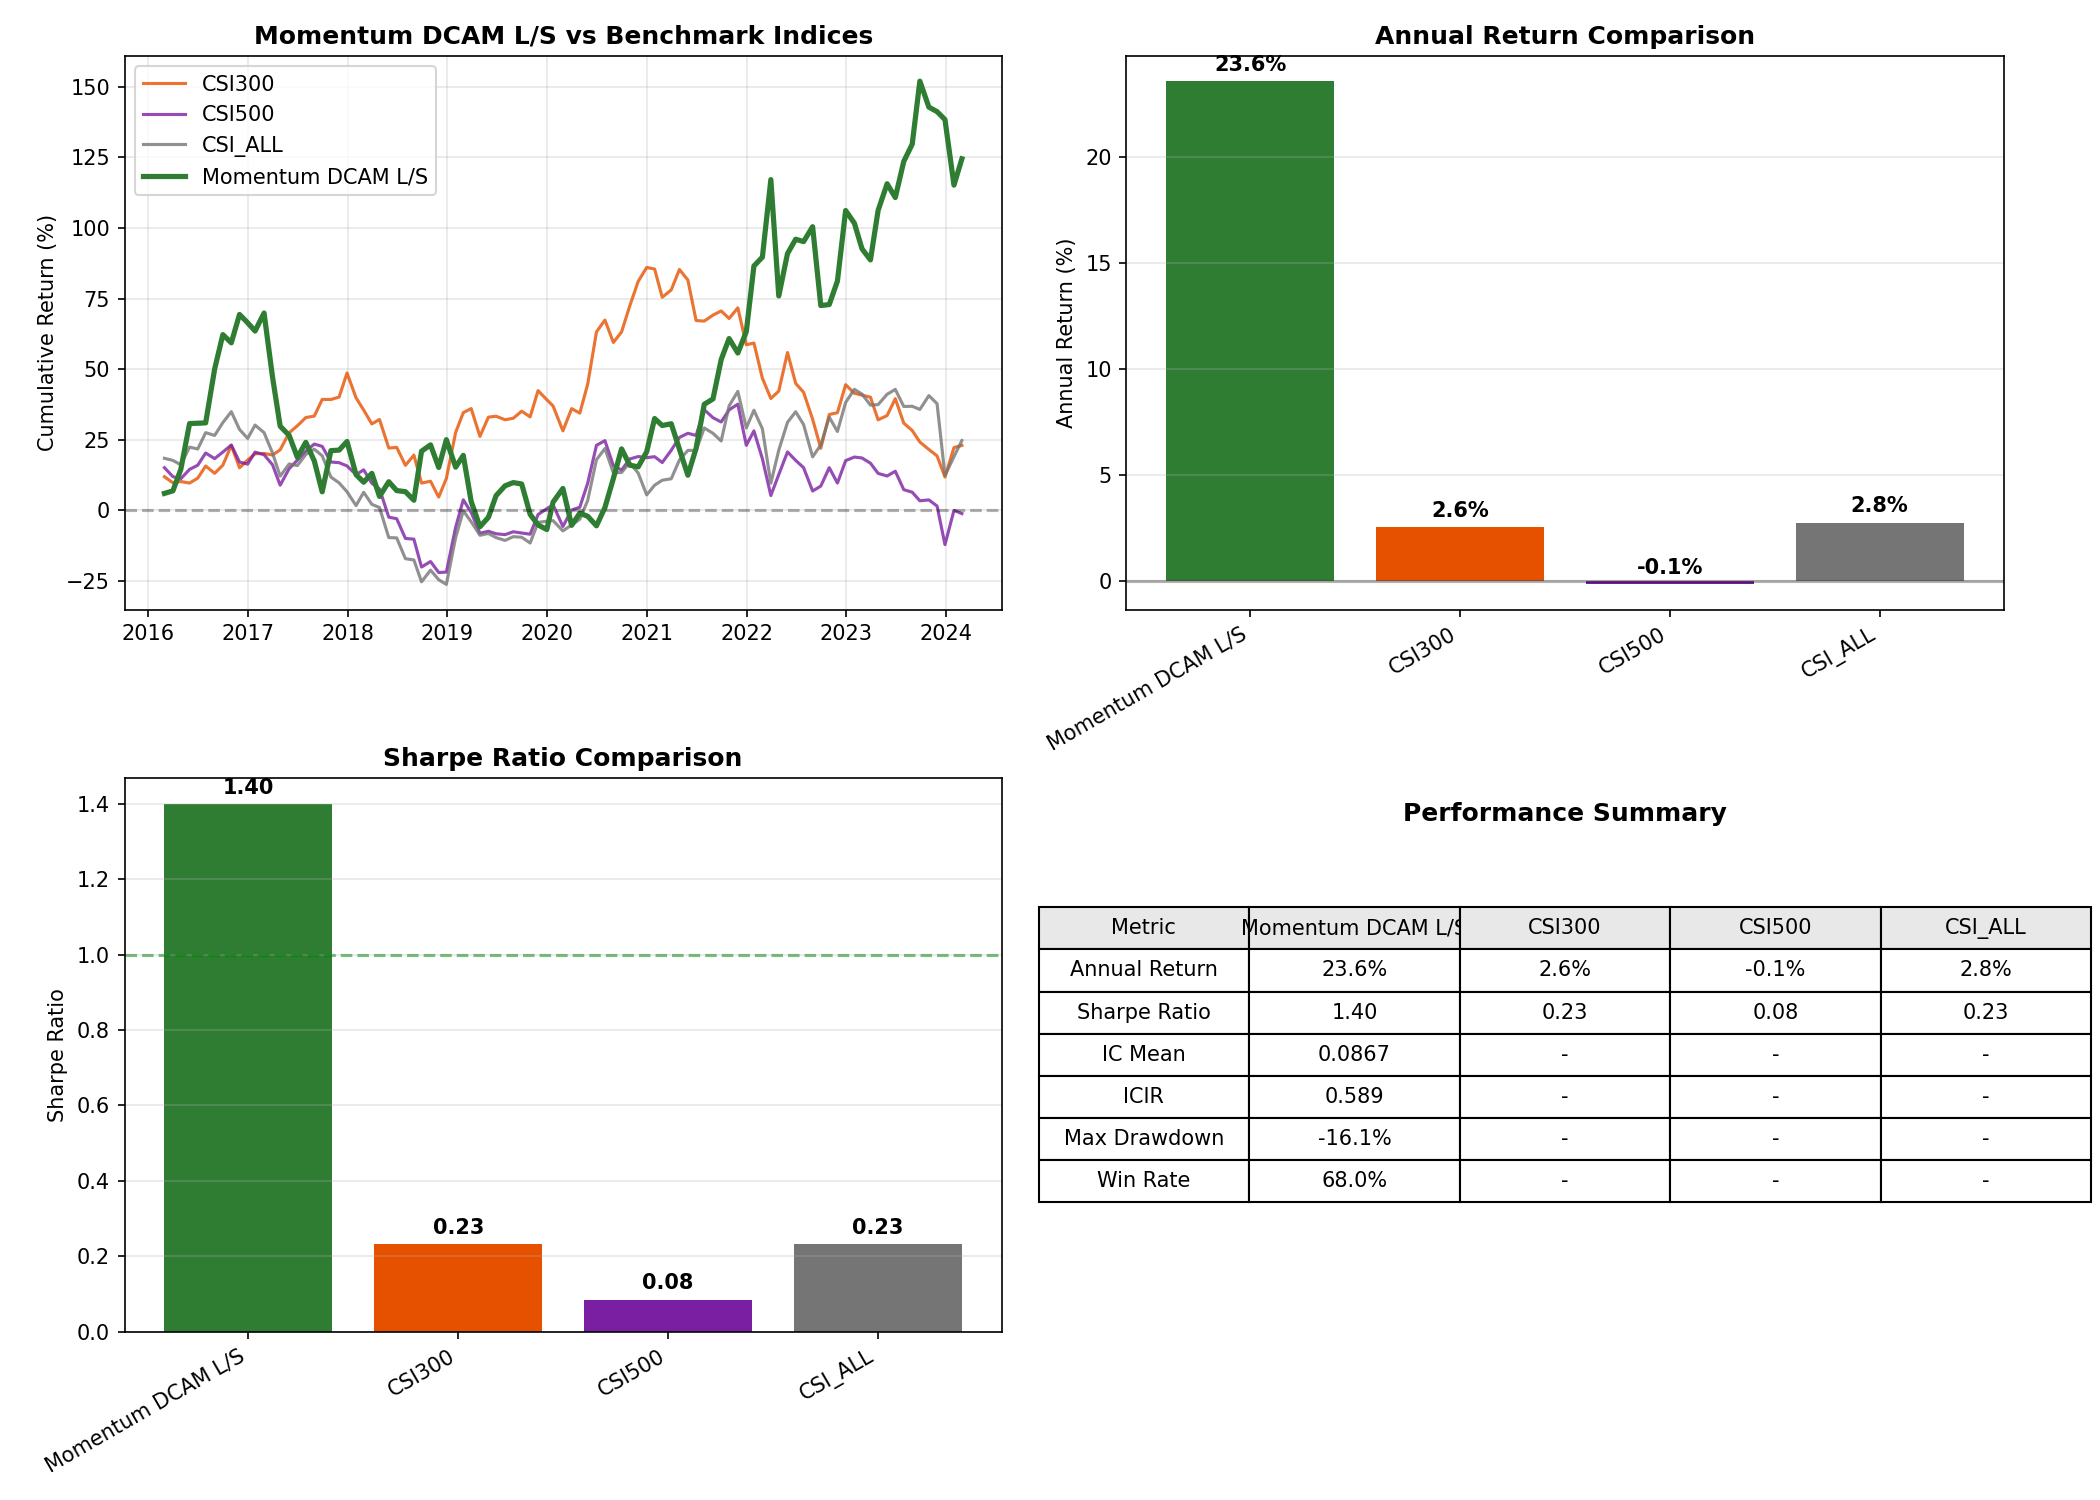
The Momentum DCAM long-short portfolio achieves 23.6% annualized return with a Sharpe ratio of 1.40, significantly outperforming all CSI benchmark indices. The model maintains a 68% monthly win rate.
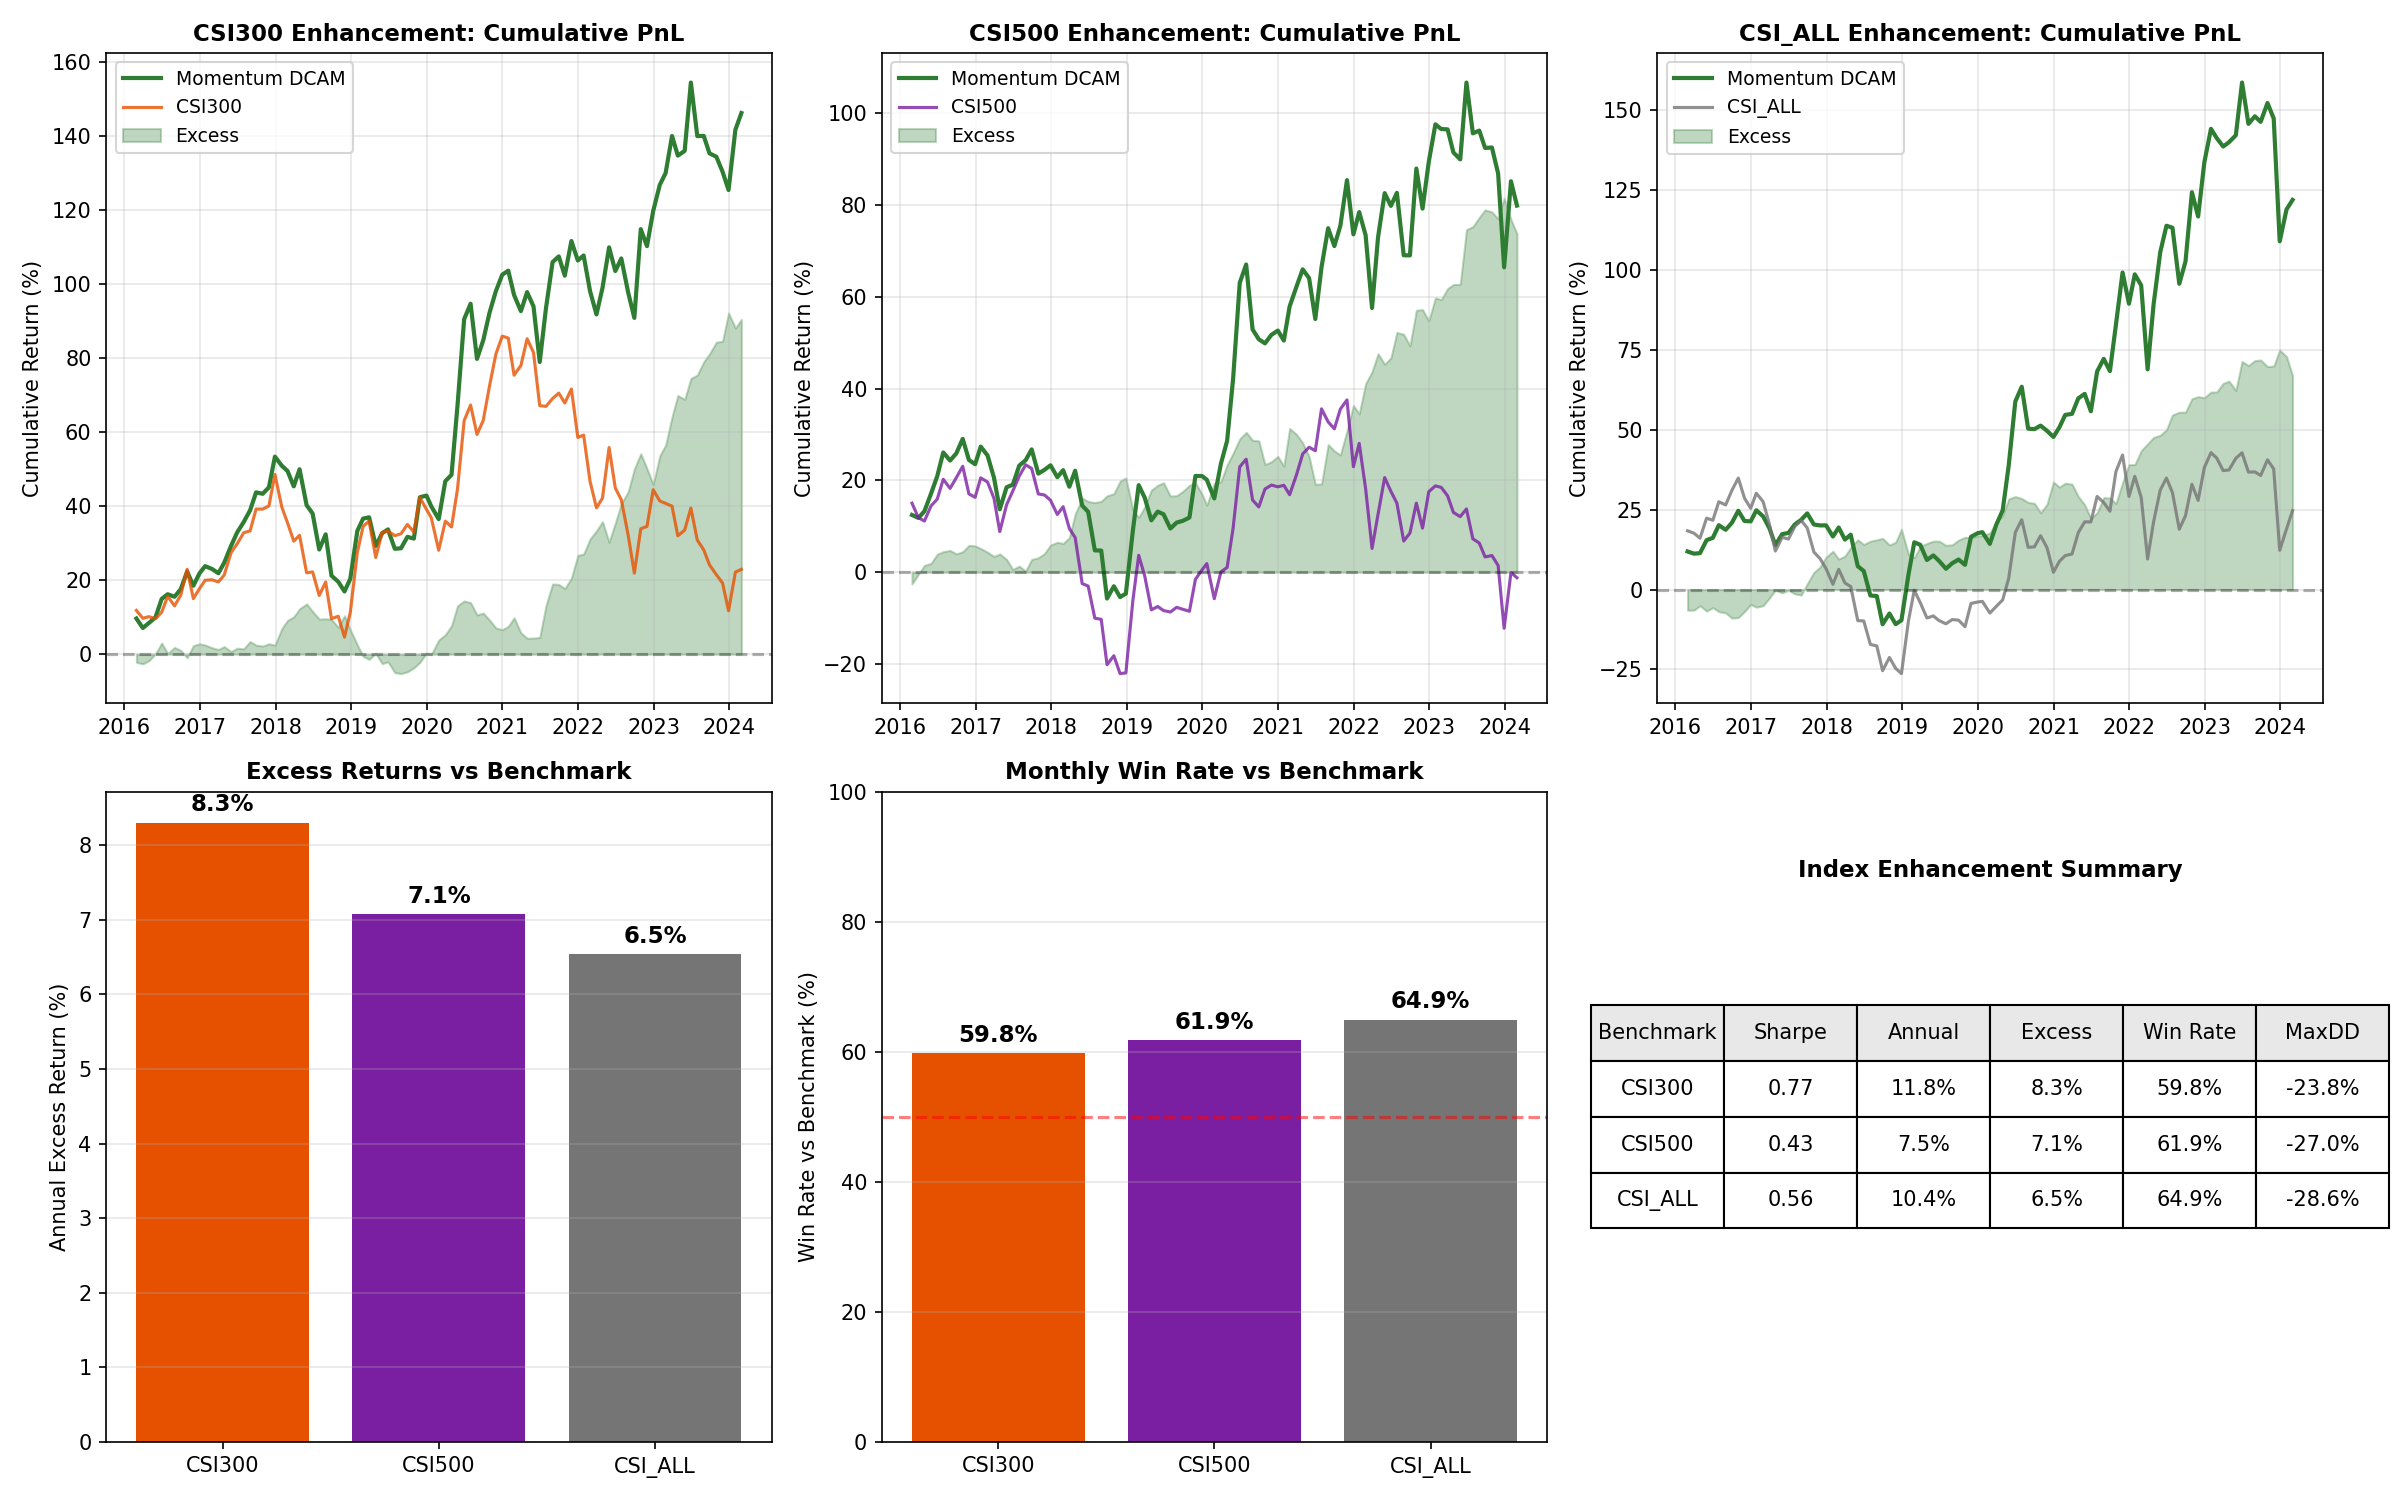
Index Enhancement
Applied as an index enhancement strategy, DCAM generates 6.5-8.3% annual excess returns across CSI300, CSI500, and CSI ALL with monthly win rates of 60-65%.
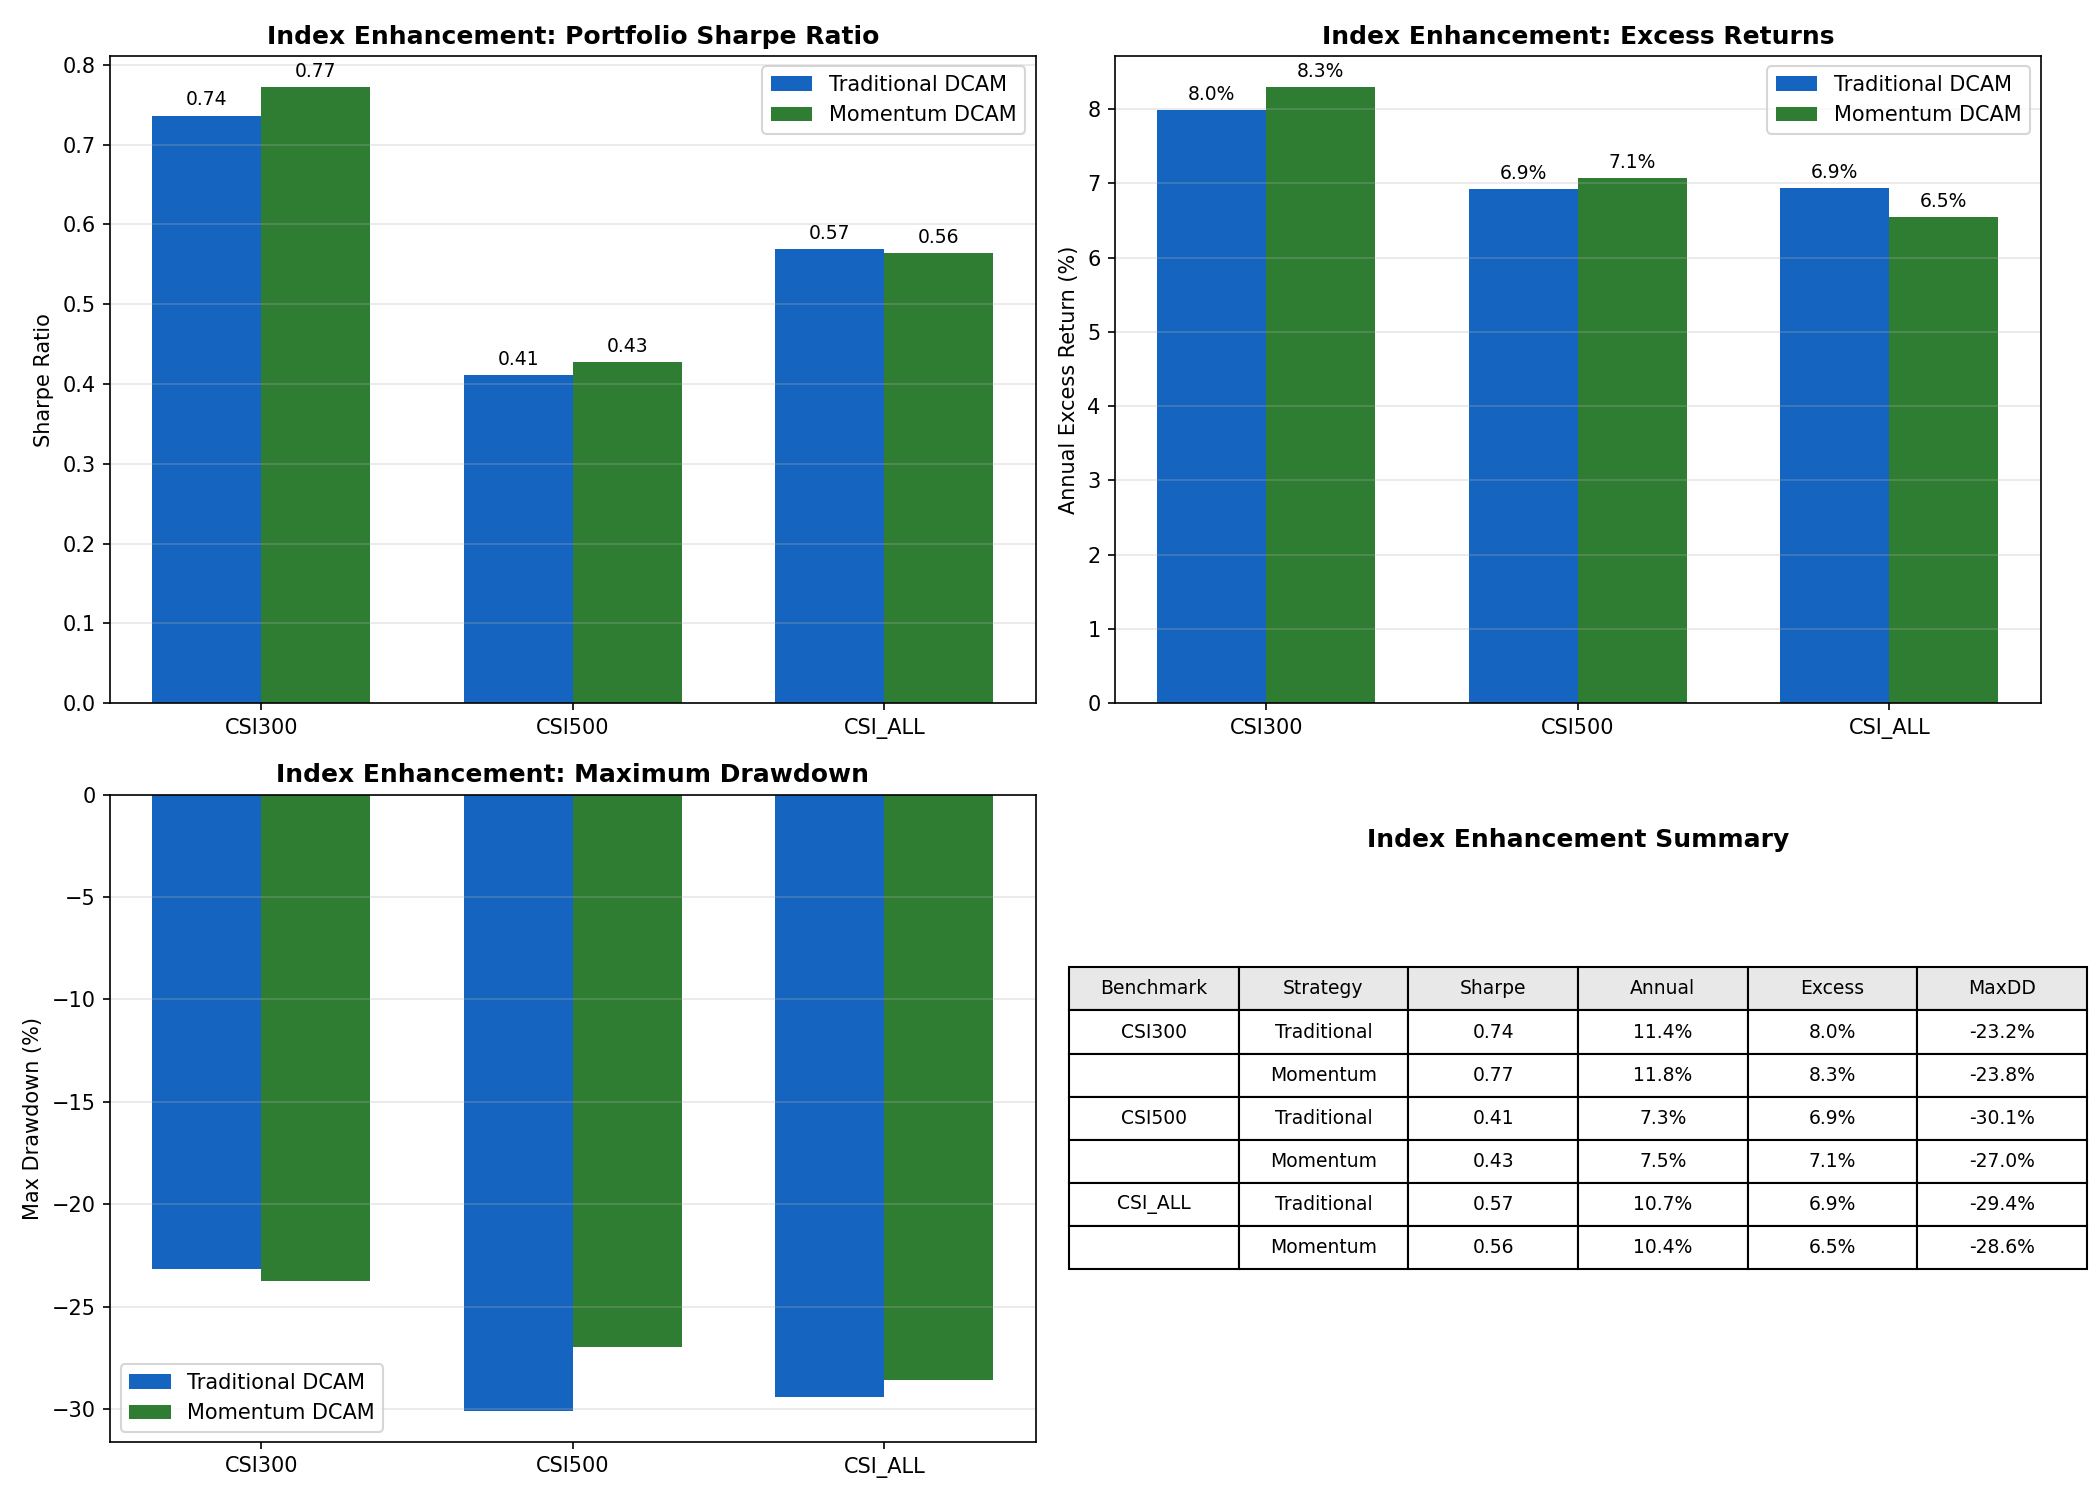
Traditional vs Momentum DCAM
Adding factor momentum signals improves Sharpe ratios and excess returns on CSI300 and CSI500, while reducing maximum drawdown on CSI500 from -30.1% to -27.0%.
Risk-Adjusted Performance
All three benchmarks achieve information ratios near 1.0 with tracking error around 7-8%, confirming consistent alpha generation with controlled risk.
![]()
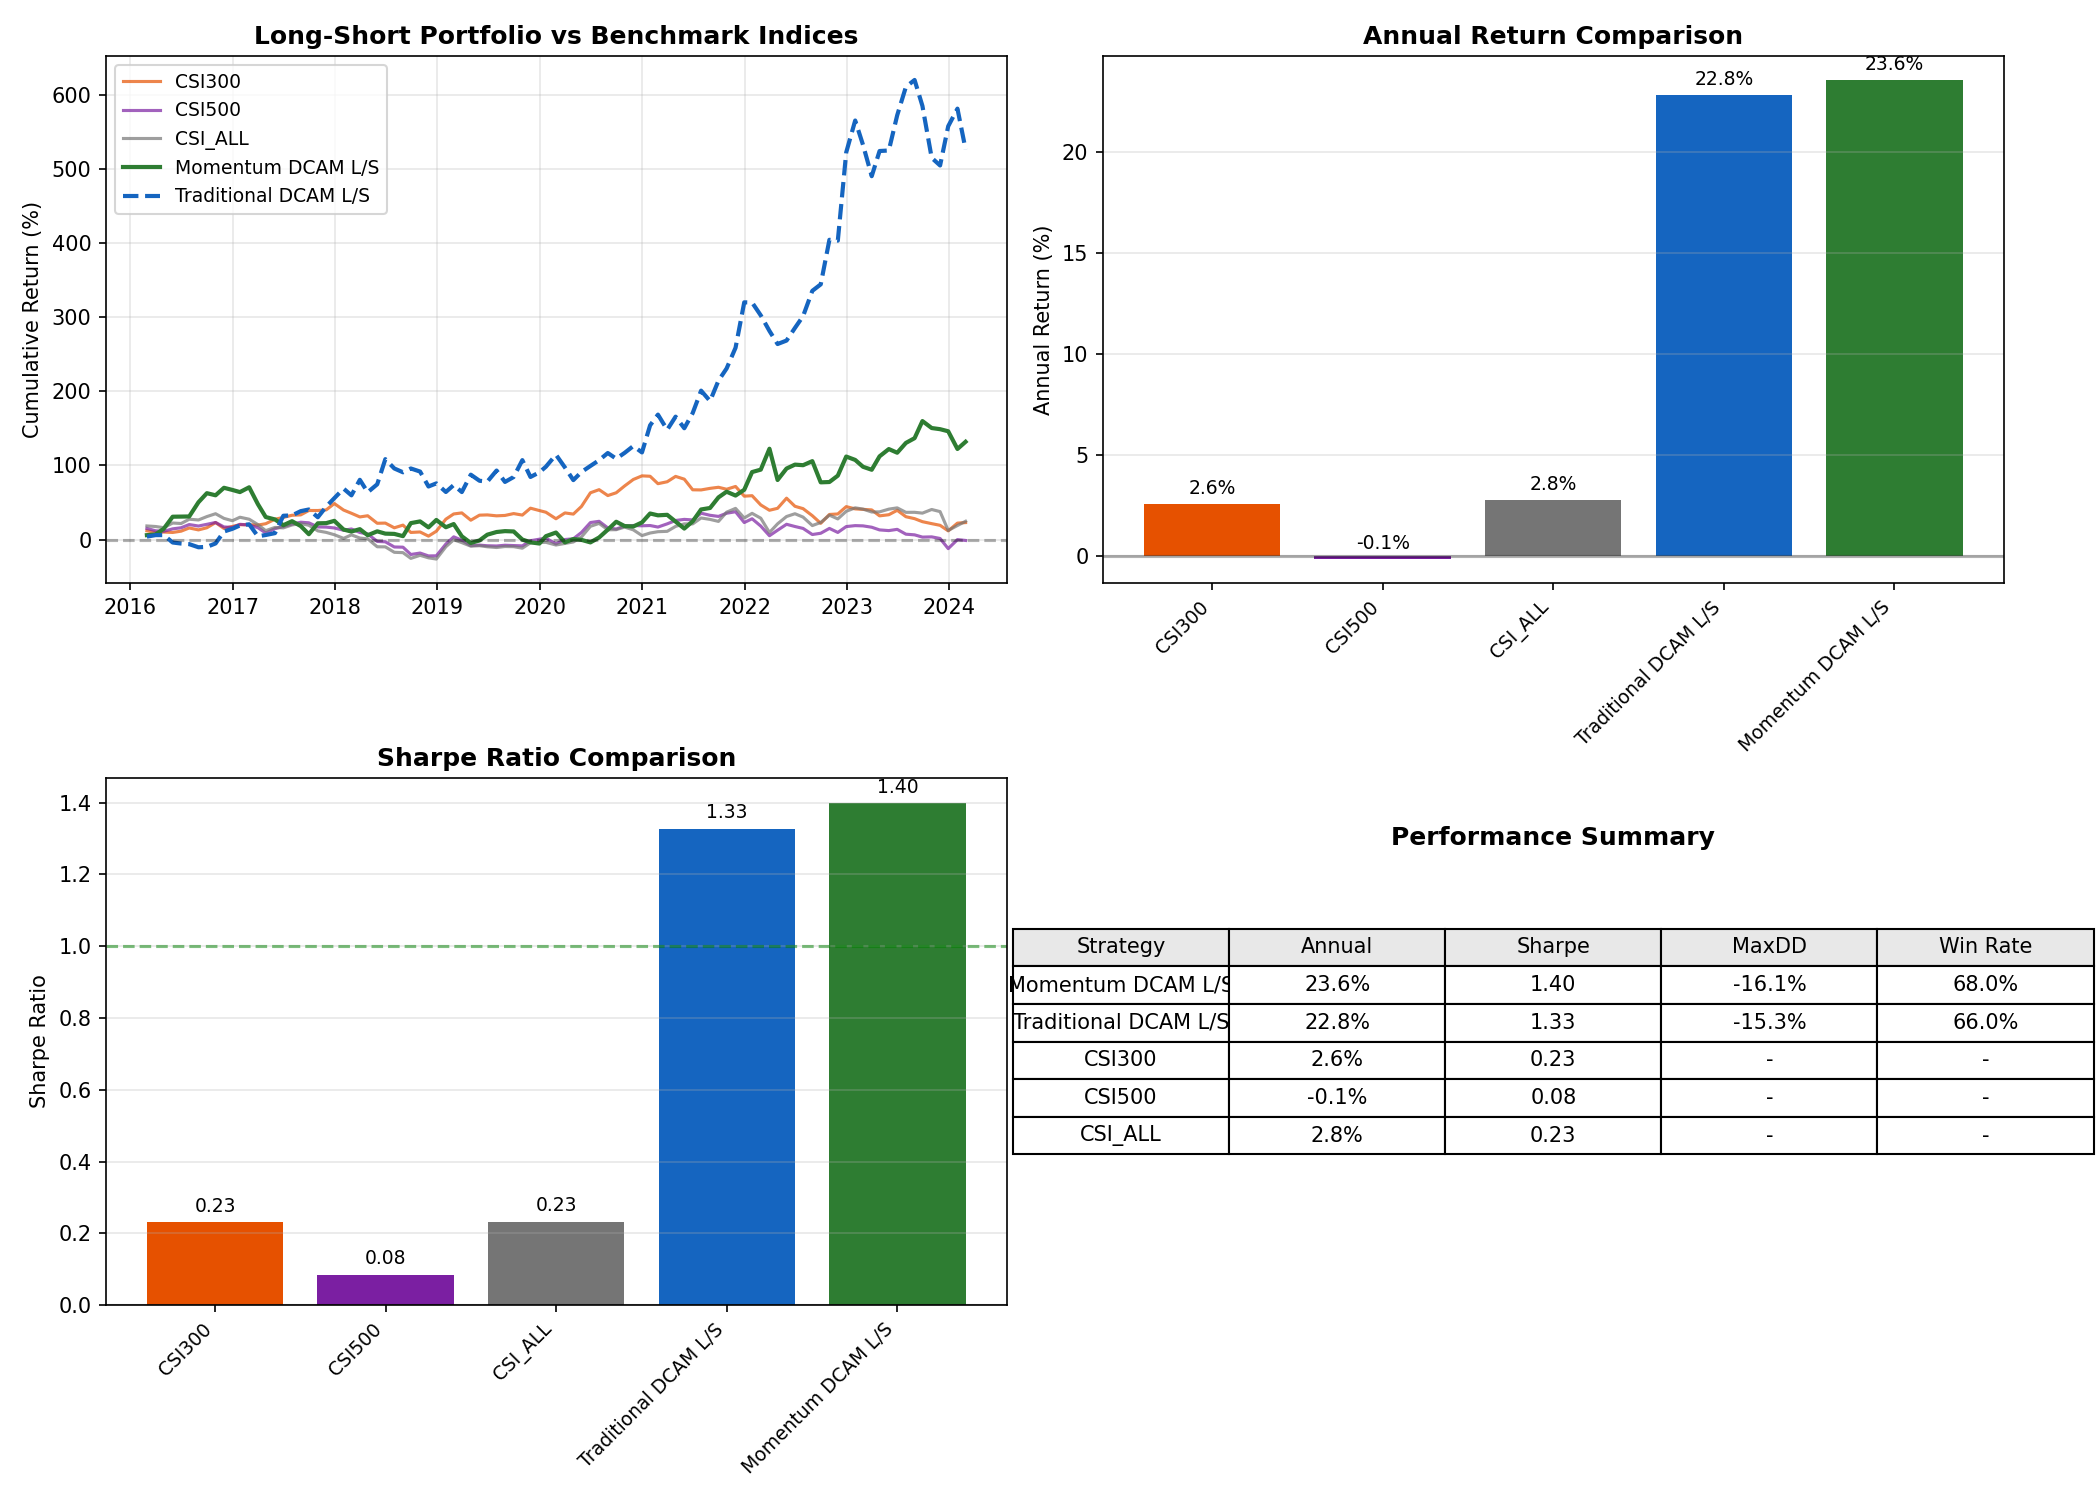
Full Comparison
Both Traditional and Momentum DCAM long-short strategies dominate benchmark indices, with Sharpe ratios of 1.33 and 1.40 respectively versus 0.08-0.23 for the benchmarks.
Tech Stack
Python, NumPy, pandas, scikit-learn (ElasticNet), scipy (Lowdin orthogonalization)