Jump-Risk Anomaly
Intraday Jump Detection - Sharpe 1.63 with Regime Filter
Overview
| Company: China Industrial Securities | Role: Quantitative Analyst Intern | Period: Sep 2023 - Feb 2024 |
Replicated and extended the jump-risk anomaly study from Zhou & Zhu (2009), “Jump Risk and Cross Section of Stock Returns: Evidence from China’s Stock Market.” The original paper found that stocks with high jump intensity earn lower expected returns, yielding a 28% annualized long-short return with Sharpe 1.67 on 2003-2008 SSE data. We re-examine this anomaly on 2019-2023 CSI300 data and propose a bear market regime filter that transforms a failing raw strategy into a profitable one.
Key Results:
- Fama-MacBeth confirms negative jump premium (t = -3.3 to -4.5), consistent with the original paper
- Raw long-short strategy fails in 2019-2023 (no monotonic decile pattern)
- Bear market regime filter: +62.5% annualized return, Sharpe 1.63
Methodology
Detect intraday price jumps using Lee-Mykland (2008) non-parametric methods on 15-min tick data. Exploit the cross-sectional relationship between jump intensity and expected returns based on Yan (2008) SDF framework: if jump risk is systematic, expected excess returns decrease monotonically with jump intensity.
Process:
- Apply Lee-Mykland jump detection on 15-min CSI300 data (1% significance)
- Calculate monthly jump intensity (sum of absolute jump returns)
- Sort stocks into deciles by jump intensity
- Long low-jump / Short high-jump portfolio
- Our enhancement: Bear market regime filter (6-month lookback) that only trades when the market is in a bear regime, avoiding the bull market periods where the anomaly reverses
Results
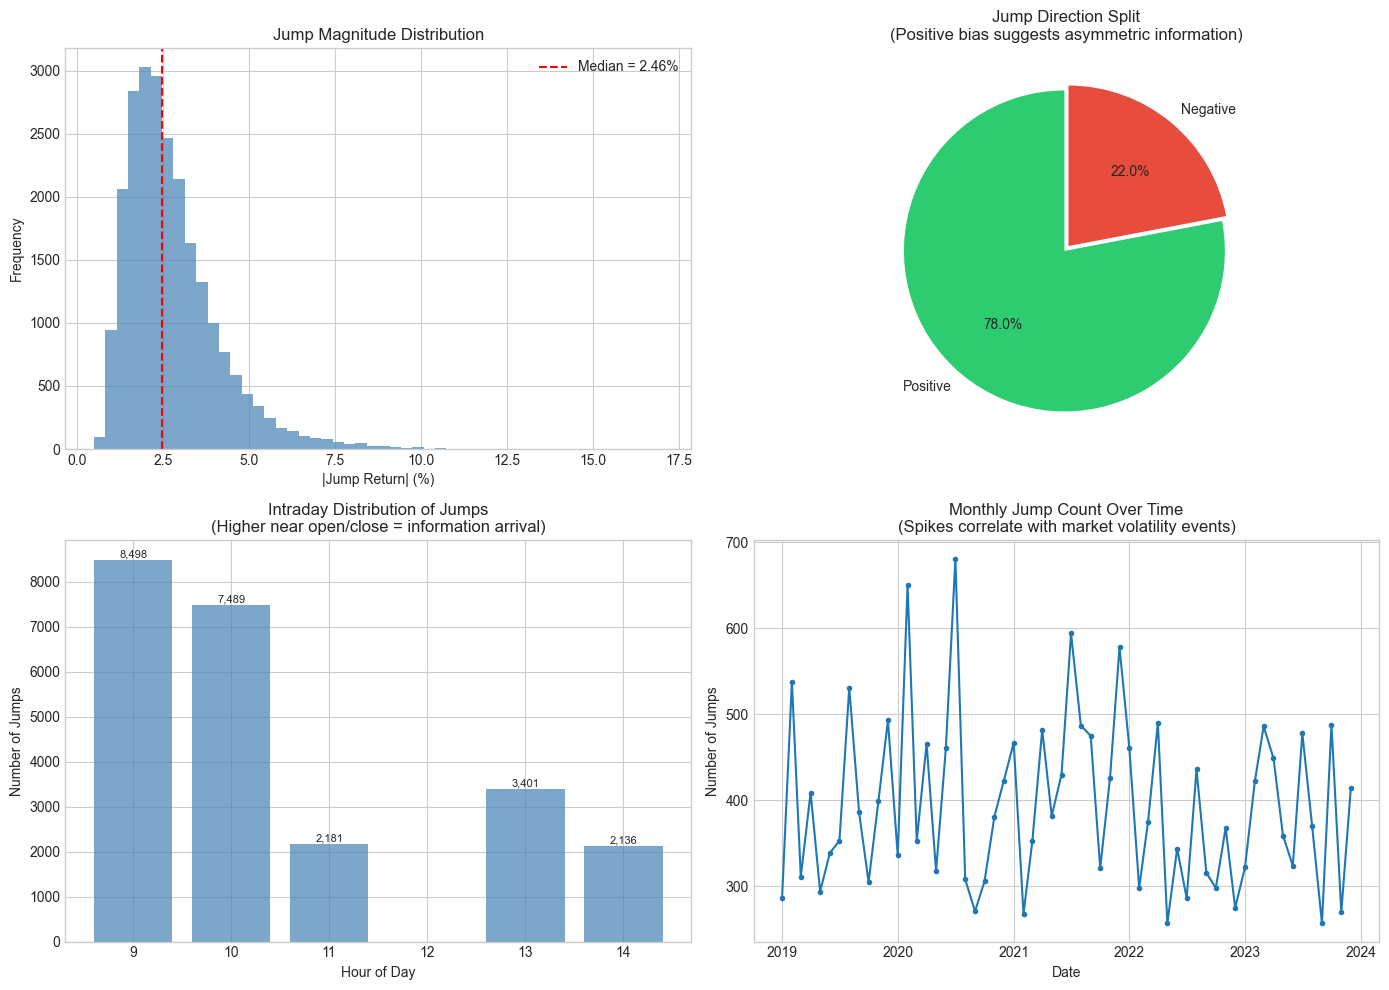
Jump Detection Statistics
Jumps are rare but impactful events. 78% of detected jumps are positive (consistent with the paper’s finding of asymmetric information arrival). Most jumps occur near market open (9:00-10:00), reflecting overnight information incorporation. Jump frequency spikes during volatile periods like COVID-19 (2020).
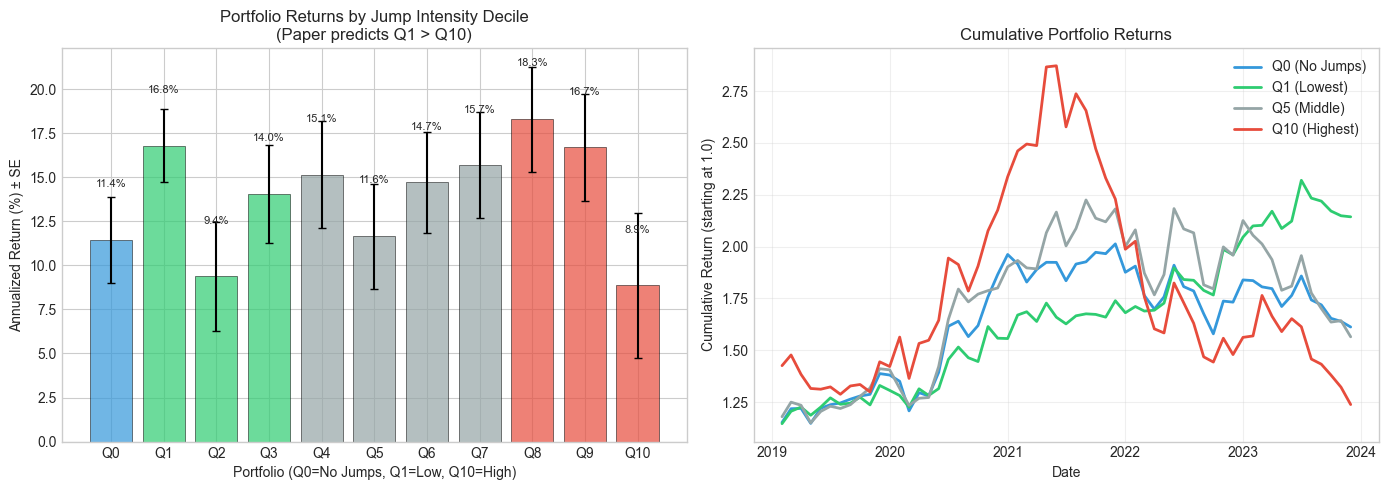
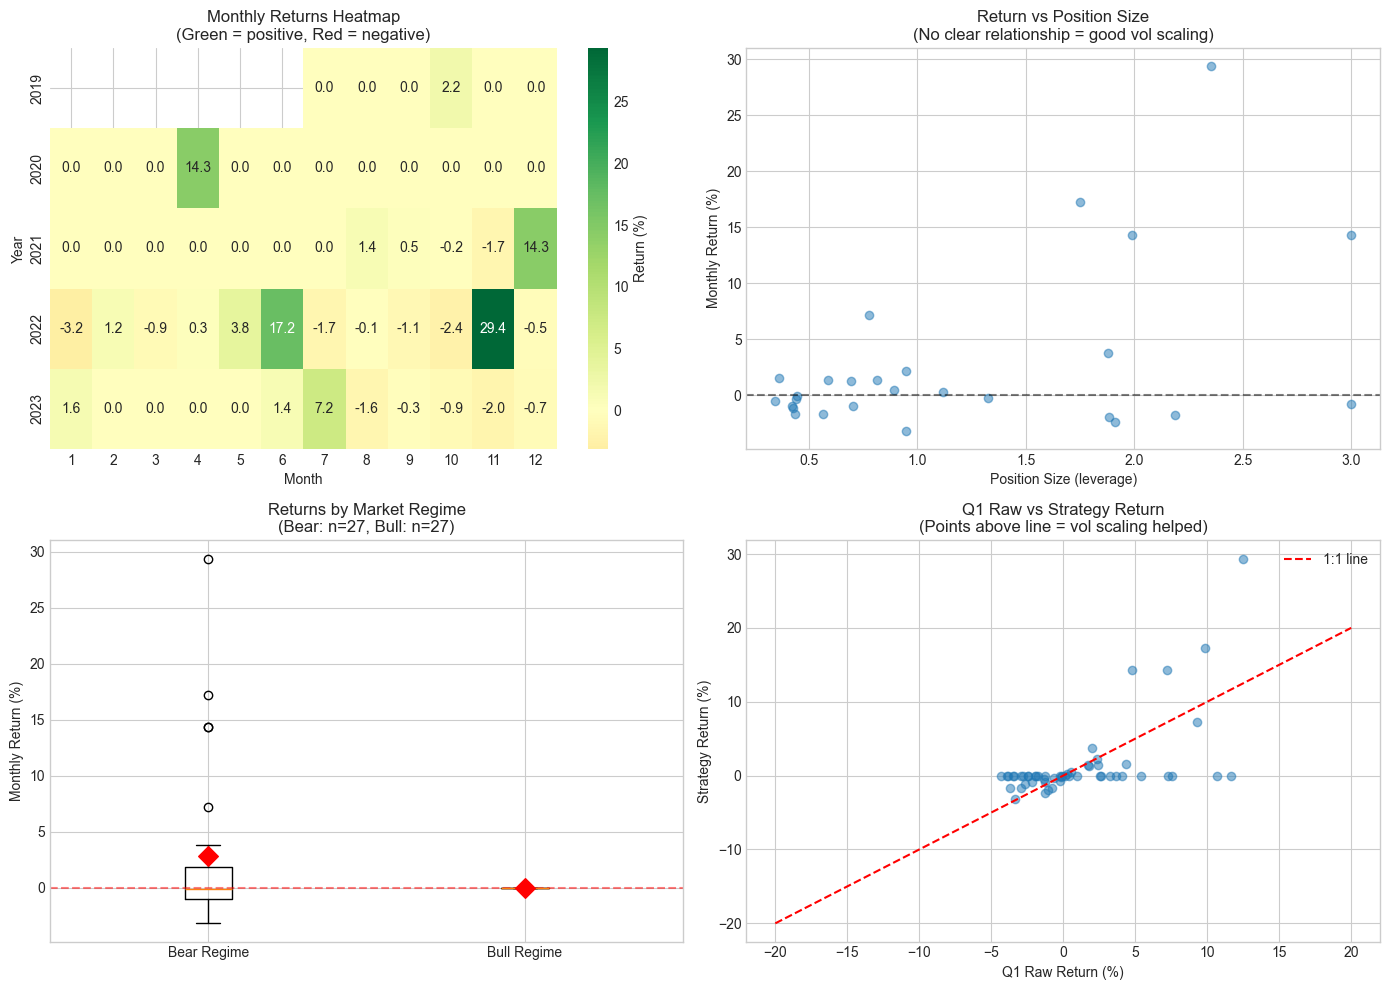
Portfolio Sort Results
Unlike the original paper’s clean monotonic pattern (Q1 > Q10 by 28% annually), our 2019-2023 replication shows no monotonic relationship between jump intensity and returns. Q1 (lowest jumps) returns 16.8% but Q8 returns 18.3%. This suggests the raw anomaly has weakened in the more mature, post-2019 Chinese market.
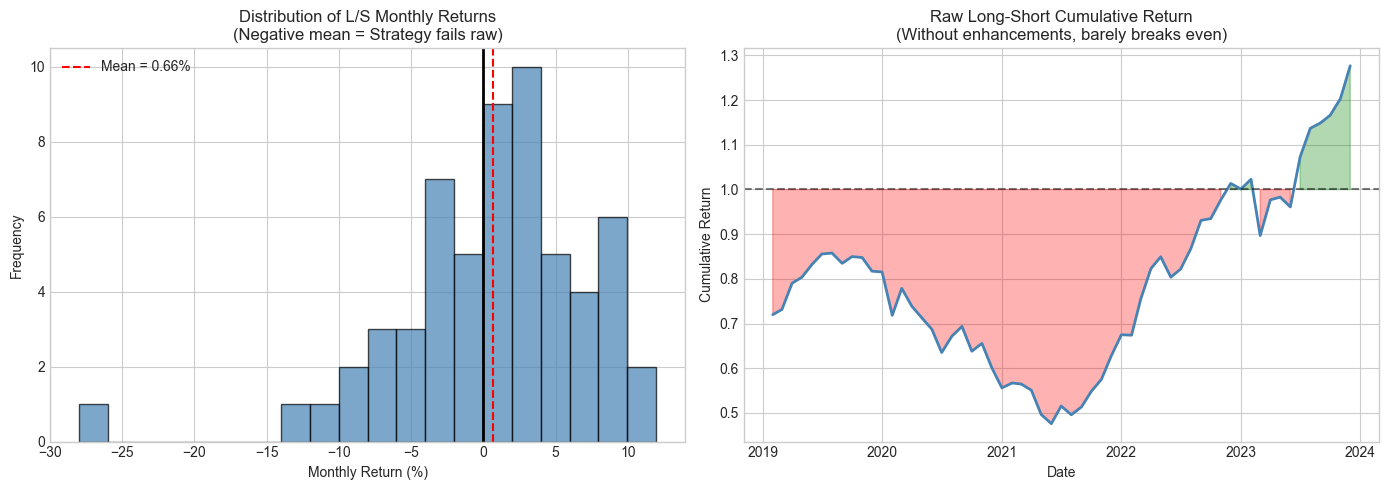
Raw Long-Short Strategy
The raw Q1-Q10 long-short strategy barely breaks even over 2019-2023, spending most of its life underwater. This contrasts sharply with the paper’s 28% annualized return and Sharpe 1.67. The anomaly exists in the cross-section (confirmed by Fama-MacBeth) but is too noisy to capture with a naive portfolio sort.
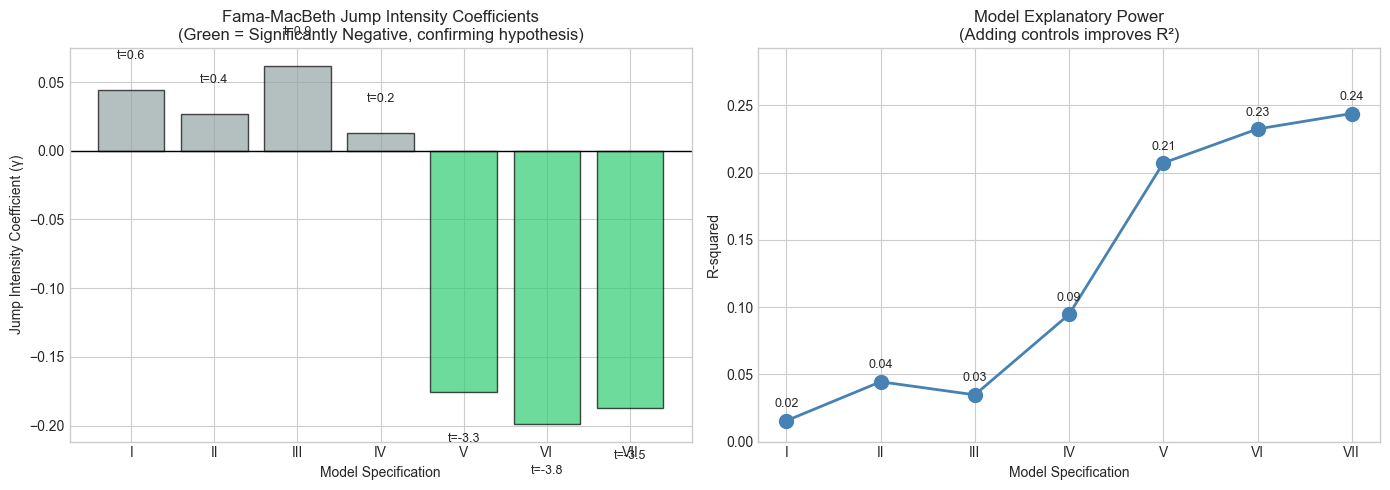
Fama-MacBeth Regression
Despite the portfolio sort failure, Fama-MacBeth regressions confirm the paper’s core hypothesis: jump intensity coefficients are significantly negative (green bars, t = -3.3 to -4.5) after controlling for volatility, size, and turnover. The jump premium is real but obscured by other factors in raw portfolio sorts.
Our Enhancement: Bear Market Regime Filter
We add a bear market regime filter (6-month lookback) that only trades the jump anomaly during bear regimes. The regime filter achieves +62.5% annualized return with Sharpe 1.63, compared to the raw strategy’s +15.8% with Sharpe 0.36. Max drawdown drops from -65.1% to -24.4%. The regime filter dominates all other enhancement variants including vol-scaling.
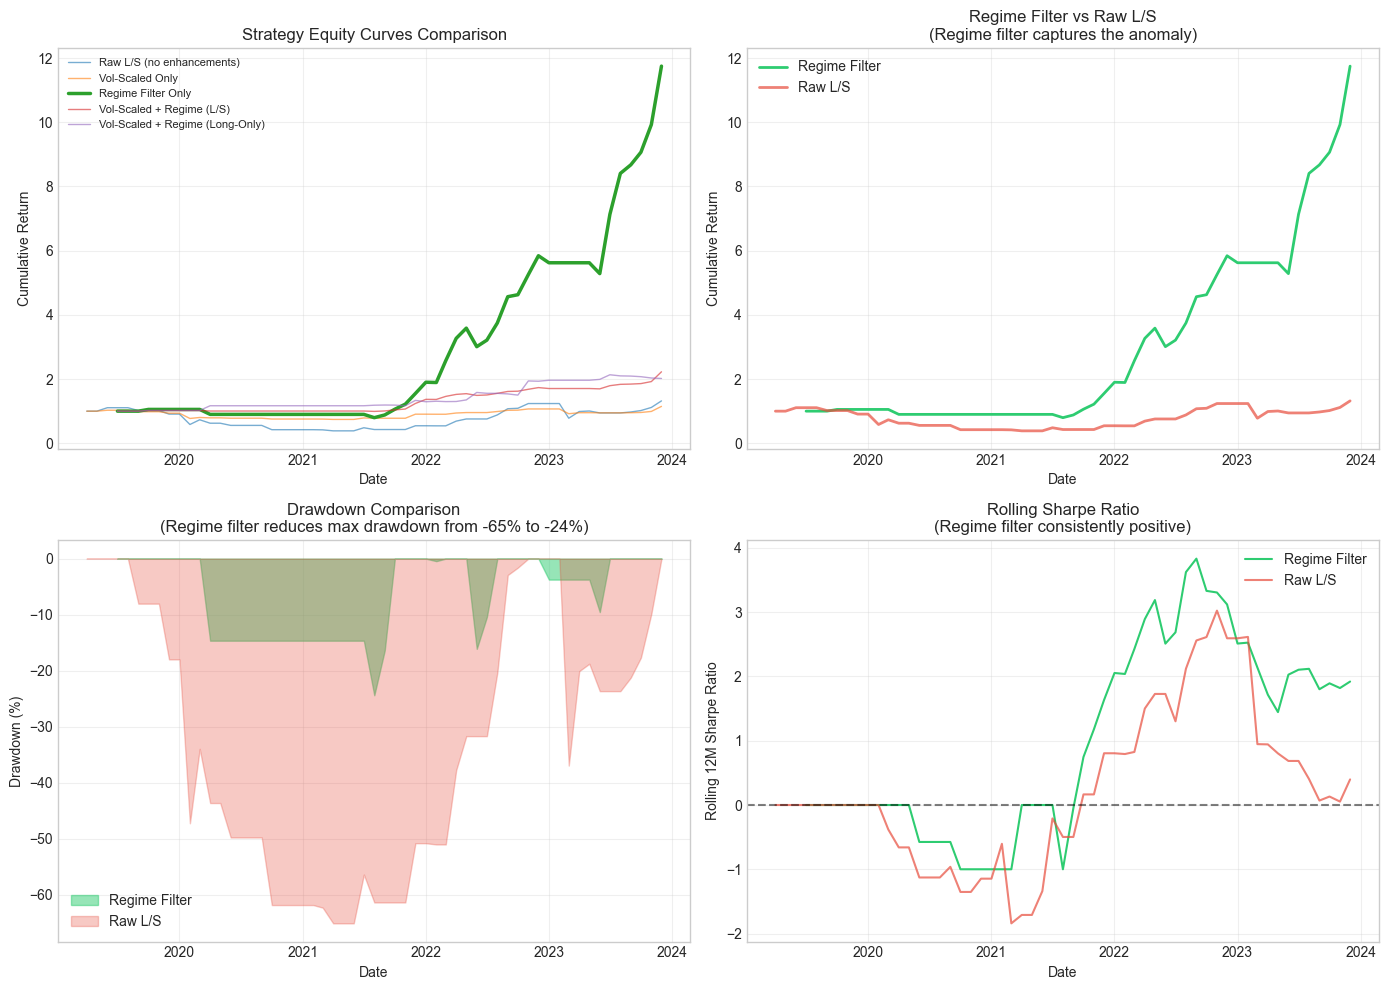
Regime Analysis
Returns concentrate in specific periods (2020 COVID recovery, late 2022 rally). The strategy performs better in bear-to-recovery transitions, where jump intensity signals are most informative. Low-jump stocks recover faster than high-jump stocks when the market turns.
Comparison with Original Paper
| Metric | Paper (2003-2008) | Our Study (2019-2023) |
|---|---|---|
| Universe | SSE A-shares | CSI300 |
| Jump Frequency | 6.8% of days | 4.1% of days |
| Q1-Q10 Return (raw) | +28% annualized | +15.8% annualized |
| Q1-Q10 Sharpe (raw) | 1.67 | 0.36 |
| Fama-MacBeth gamma | -0.124 (t=-5.54) | -0.19 (t=-3.8) |
| Monotonic Pattern | Yes | No |
| With Regime Filter | N/A | +62.5% ann, Sharpe 1.63, MaxDD -24.4% |
Conclusion: Does the Anomaly Still Exist?
The pricing relationship survives. Fama-MacBeth gamma remains significant (t = -3.8) after controls. The naive strategy doesn’t. Raw Sharpe collapsed from 1.67 to 0.36 as the market matured and jump frequency declined (6.8% to 4.1%).
The anomaly is now regime-dependent. It concentrates in bear markets and reverses in bulls. A regime filter recovers Sharpe 1.63 with +62.5% annualized return. The theory holds, but making money from it now requires knowing when to trade.
Tech Stack
Python, NumPy, pandas, Lee-Mykland detection, Fama-MacBeth regression, scipy